
Getting to Know the ‘Wizard Simulation’ Forecasting Software – What Is It and How Can It Benefit Justice Leaders?
Is Forecasting a Correctional Population Difficult?
As a mathematician – and from my 30 years working exclusively as a criminal justice researcher – I can tell you that anyone with a general understanding of statistics and a spreadsheet can do a forecast. At its core, a forecast is a simple estimation of what the future holds – in this case, the population or bed space in a correctional facility. But as someone passionately devoted to informed decision making, that shouldn’t be good enough for our justice leaders.
A simulation model is something different. For correctional populations, it not only answers the question of how many beds will be needed in the future but can also tell you why those beds are needed. By employing a simulation model, you’ll know what type of individuals will be housed in those beds (e.g. by gender, classification level) and have the power to quantify future changes.
What is the Wizard Simulation Model?
In early 2024, CGL Companies acquired an exclusive license for the Wizard simulation software, a proprietary software program specifically designed to simulate and forecast future correctional populations. Originally designed as a mainframe software package in 1984, the Wizard model has gone through numerous revisions and improvements over the years. In 1990, the technology was adapted to a PC computing environment with a DOS based microcomputer simulation model. In 1997, this technology officially became known as the “Wizard” model and was added to a Windows NT/95 environment. In 1999, it was rewritten to run more efficiently for modern Windows-based computers.
Additional improvement continued in the 2000s, ending in the package used today, which incorporates all the original features plus the ability to forecast classification levels, special needs populations, and elderly individuals. The simulation model is an example of a stochastic entity model in the sense that the model is conceptually designed around the movement of individual cases (persons) into, through and out of a system. The model also makes use of the Monte Carlo simulation technique that predicts possible outcomes of an uncertain event while also adding an element of randomness to the model. Once a model is built, individual cases are processed through a series of probability distribution arrays summarizing both groups of like individuals and calculated time served, which provide computations for specific cases, each with individual characteristics and decisions points.
Because no two criminal justice systems are alike, there is no single Wizard simulation model. Instead, the software allows analysts to customize and construct models that mimic the actual flow of offenders based on the unique sentencing structure and policy environments of the target system. It is best to think of the Wizard simulation software as a “shell” or beginning structure that can be constructed in any fashion.
A visual of this flow in a typical jail system can be seen below. In this instance, we can envision everything in the large black box to be modeled by the Wizard software:
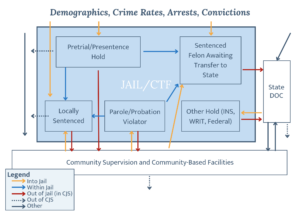
When loaded with accurate data, the model mimics the flow of persons though a jail system and produces a monthly forecast, accurate to within +/- two percent.
Since its creation, the Wizard model has been used to build more than 500 models for more than 100 state, local, adult and juvenile systems across the country.
The Necessary Data
Because the Wizard simulation software attempts to mirror a criminal justice system, it must include a wide array of data that have a direct and indirect impact on correctional population growth. While some of this data is more easily obtained than others, all of it can be collected from even the most basic of systems. Necessary data can be separated into two main categories – external and internal:
External factors reflect the interplay of demographic, socio-economic, and crime trends that produce arrests, and offenders’ initial entry into the criminal justice process. Most of this data is widely available from state and county officials.
Internal factors include a description of the various decision points within the criminal justice system that cumulatively determine the volume of admissions and subsequent lengths of stay (LOS). In a detention setting, these decision points begin with police and end with county officials who, within the context of court dispositions and imposed sentences, have the authority to release and recommit persons to jail; give and restore a wide array of ‘good time’ credits; issue “Failure to Appear” or “Failure to Pay” (FTA/FTP) warrants; offer jail diversion options; and offer programs that may reduce re-arrest and/or re-conviction. In a correctional setting, these decisions begin with a felony sentence and commitment to a state prison and end with a release from either a parole board or termination of sentence at the conclusion of time served/sentence served, as defined by the particular system.
Internal data is obtained through case level information provided from the correctional system’s Management Information Systems (MIS) in the form of extract files. While this is the harder of the two data categories, the key to obtaining this data is having the right people asking the right people the right questions. (On a personal note – in my 30 years, I have never not been able to obtain the necessary data. If there is a will, there is always a way.)
Simulation Model Benefits
As stated earlier, one of the major benefits of building and running a simulation model-based corrections population forecast is to not only know how many but why. Going through the data collection and seeing the analysis results gives justice leaders perspective on who’s in their system and what their needs are, while allowing them to dismiss false narratives and anecdotal evidence. Even the most seasoned professional can be surprised to learn what is truly driving a population increase or decrease versus what they may have heard. The results can sometimes be surprising and open the door to discussions about the effectiveness and appropriateness of incarceration for certain individuals.
A Look at the Results – the Wizard Software in Action
Results of the Wizard simulation model contain endless possibilities. Since the model is custom designed for each jurisdiction, individual forecasts of highly interested groups are possible. Below is a case demonstrating an example of the power of both the Wizard simulation model and the process for constructing one.
Case Example
A local jail is concerned about the “hardening” of their population based on the longer-term effects of COVID-19 restrictions on society. They note that while their jail population originally declined dramatically during COVID, it has been increasing recently, and they anecdotally felt pretrial felons on their way to state prison are staying longer to process to disposition than before. They want to know if this is true; how much of an impact this is having; what can be done about it; and what will be the effect on their future jail population?
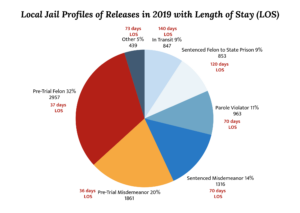
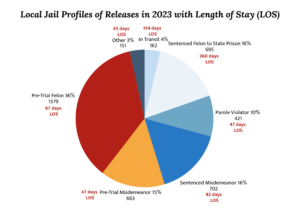
Starting with compilation of the data from generated case level extract files, we can conclusively say that yes, the overall length of stay (LOS) in their jail has gone up since 2019 (pre-COVID). From a closer examination, we can see that LOS has gone up most dramatically for individuals eventually transferred to state prison – an overall increase of 240 days or 200%.
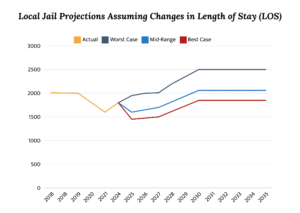
By building and using the Wizard simulation model for this jurisdiction, we can not only forecast the future population based on the most recent data, but we can also complete an alternative forecast or “what-if” scenario. Assuming the LOS for processing felons decreases 75% from 2023 levels, as a best-case scenario, and 50% reduction, as a mid-range scenario, produces a difference of 500-600 beds. This is powerful information for justice leaders to have when planning for future system needs.
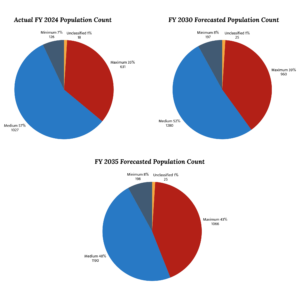
Simulation model-based forecasts also allow for forecasts to be disaggregated by housing type – an essential tool for facility planning. Using our prior mentioned example, our Wizard simulation model can also project types of beds needed under the worst-case scenario. In this example, we can quantify how the increased LOS for the most “hardened” individuals in this detention facility will increase the need for high-level security housing in the coming years.
In our presented example, a closer examination of the reasons and open discussion among county decision-makers about correcting some of the issues in case processing could make either of the scenarios a reality in the coming years. Having the data to support it, and a simulation model to quantify those changes, can be a real game changer for justice leaders.
Additional Wizard Features
The Wizard model was built for the sole purpose of forecasting correctional populations. As such, it is easily adaptable to any correctional population and contains several features only available in such a model. These features are listed below as well as recent advancements the model also allows for:
- The ability to project community supervision populations – parole, probation, and specialty housing programs.
- For a juvenile system, can project training school and detention facility populations as well as numerous pre- and post-adjudication special placement populations.
- Provides the ability to separate out the effects of legislation and policies impacting various sub-groups within the total population over time. The Wizard model has unique features that allow analysts to “phase-in” or “sunset” a variety of policy options over the course of the forecast horizon.
- Can incorporate various recidivism and program performance measures into the cycle back to incarceration.
- Projects population and movement tables, by month, and by sub-populations – allowing the user to not only project the population but also total intake and releases for the forecast period.
- Unique ability to incorporate parole board decisions into model structure and assumptions.
- Unique features allowing the user to incorporate a variety of good behavior and incentive credits to modify total LOS.
- Unique ability to incorporate age into the forecast results, giving an average age forecast or forecast of individuals over a certain age (e.g. 55+, 60+).
- Ability to forecast special needs population levels, mental health and medical unit sizes.
In the End, Trust the Data
Our world is ever increasingly focused on metrics. Using data-driven research as a basis for multimillion-dollar decisions on construction, renovation or closure is essential for criminal justice leaders. Being able to provide detailed data on who is housed in and flows in and out of the system provides quantitative understanding of the attributes of the population.
Leading in criminal justice means being entrusted with making important decisions that can impact the life and future of every individual that enters a system. That’s why it’s imperative that today’s justice leaders are equipped with the best tools to make the most informed decisions possible. The Wizard simulation model is the most advanced and only simulation model currently available that’s purposely built for correctional systems, providing features and benefits designed for model justice leaders.
Download the PDF
Meet the Author